
McCammon, Idaho
McCammon, Idaho | |
|---|---|
 Location of McCammon in Bannock County, Idaho. | |
| Coordinates: 42°38′56″N 112°11′36″W / 42.64889°N 112.19333°W | |
| Country | United States |
| State | Idaho |
| County | Bannock |
| Government | |
| • Mayor | Karlene Hall |
| Area | |
| • Total | 2.25 sq mi (5.83 km2) |
| • Land | 2.23 sq mi (5.77 km2) |
| • Water | 0.02 sq mi (0.06 km2) |
| Elevation | 4,783 ft (1,458 m) |
| Population | |
| • Total | 809 |
| • Estimate (2019)[3] | 831 |
| • Density | 372.81/sq mi (143.97/km2) |
| Time zone | UTC-7 (Mountain (MST)) |
| • Summer (DST) | UTC-6 (MDT) |
| ZIP code | 83250 |
| Area code(s) | 208, 986 |
| FIPS code | 16-48880 |
| GNIS feature ID | 0396863 |
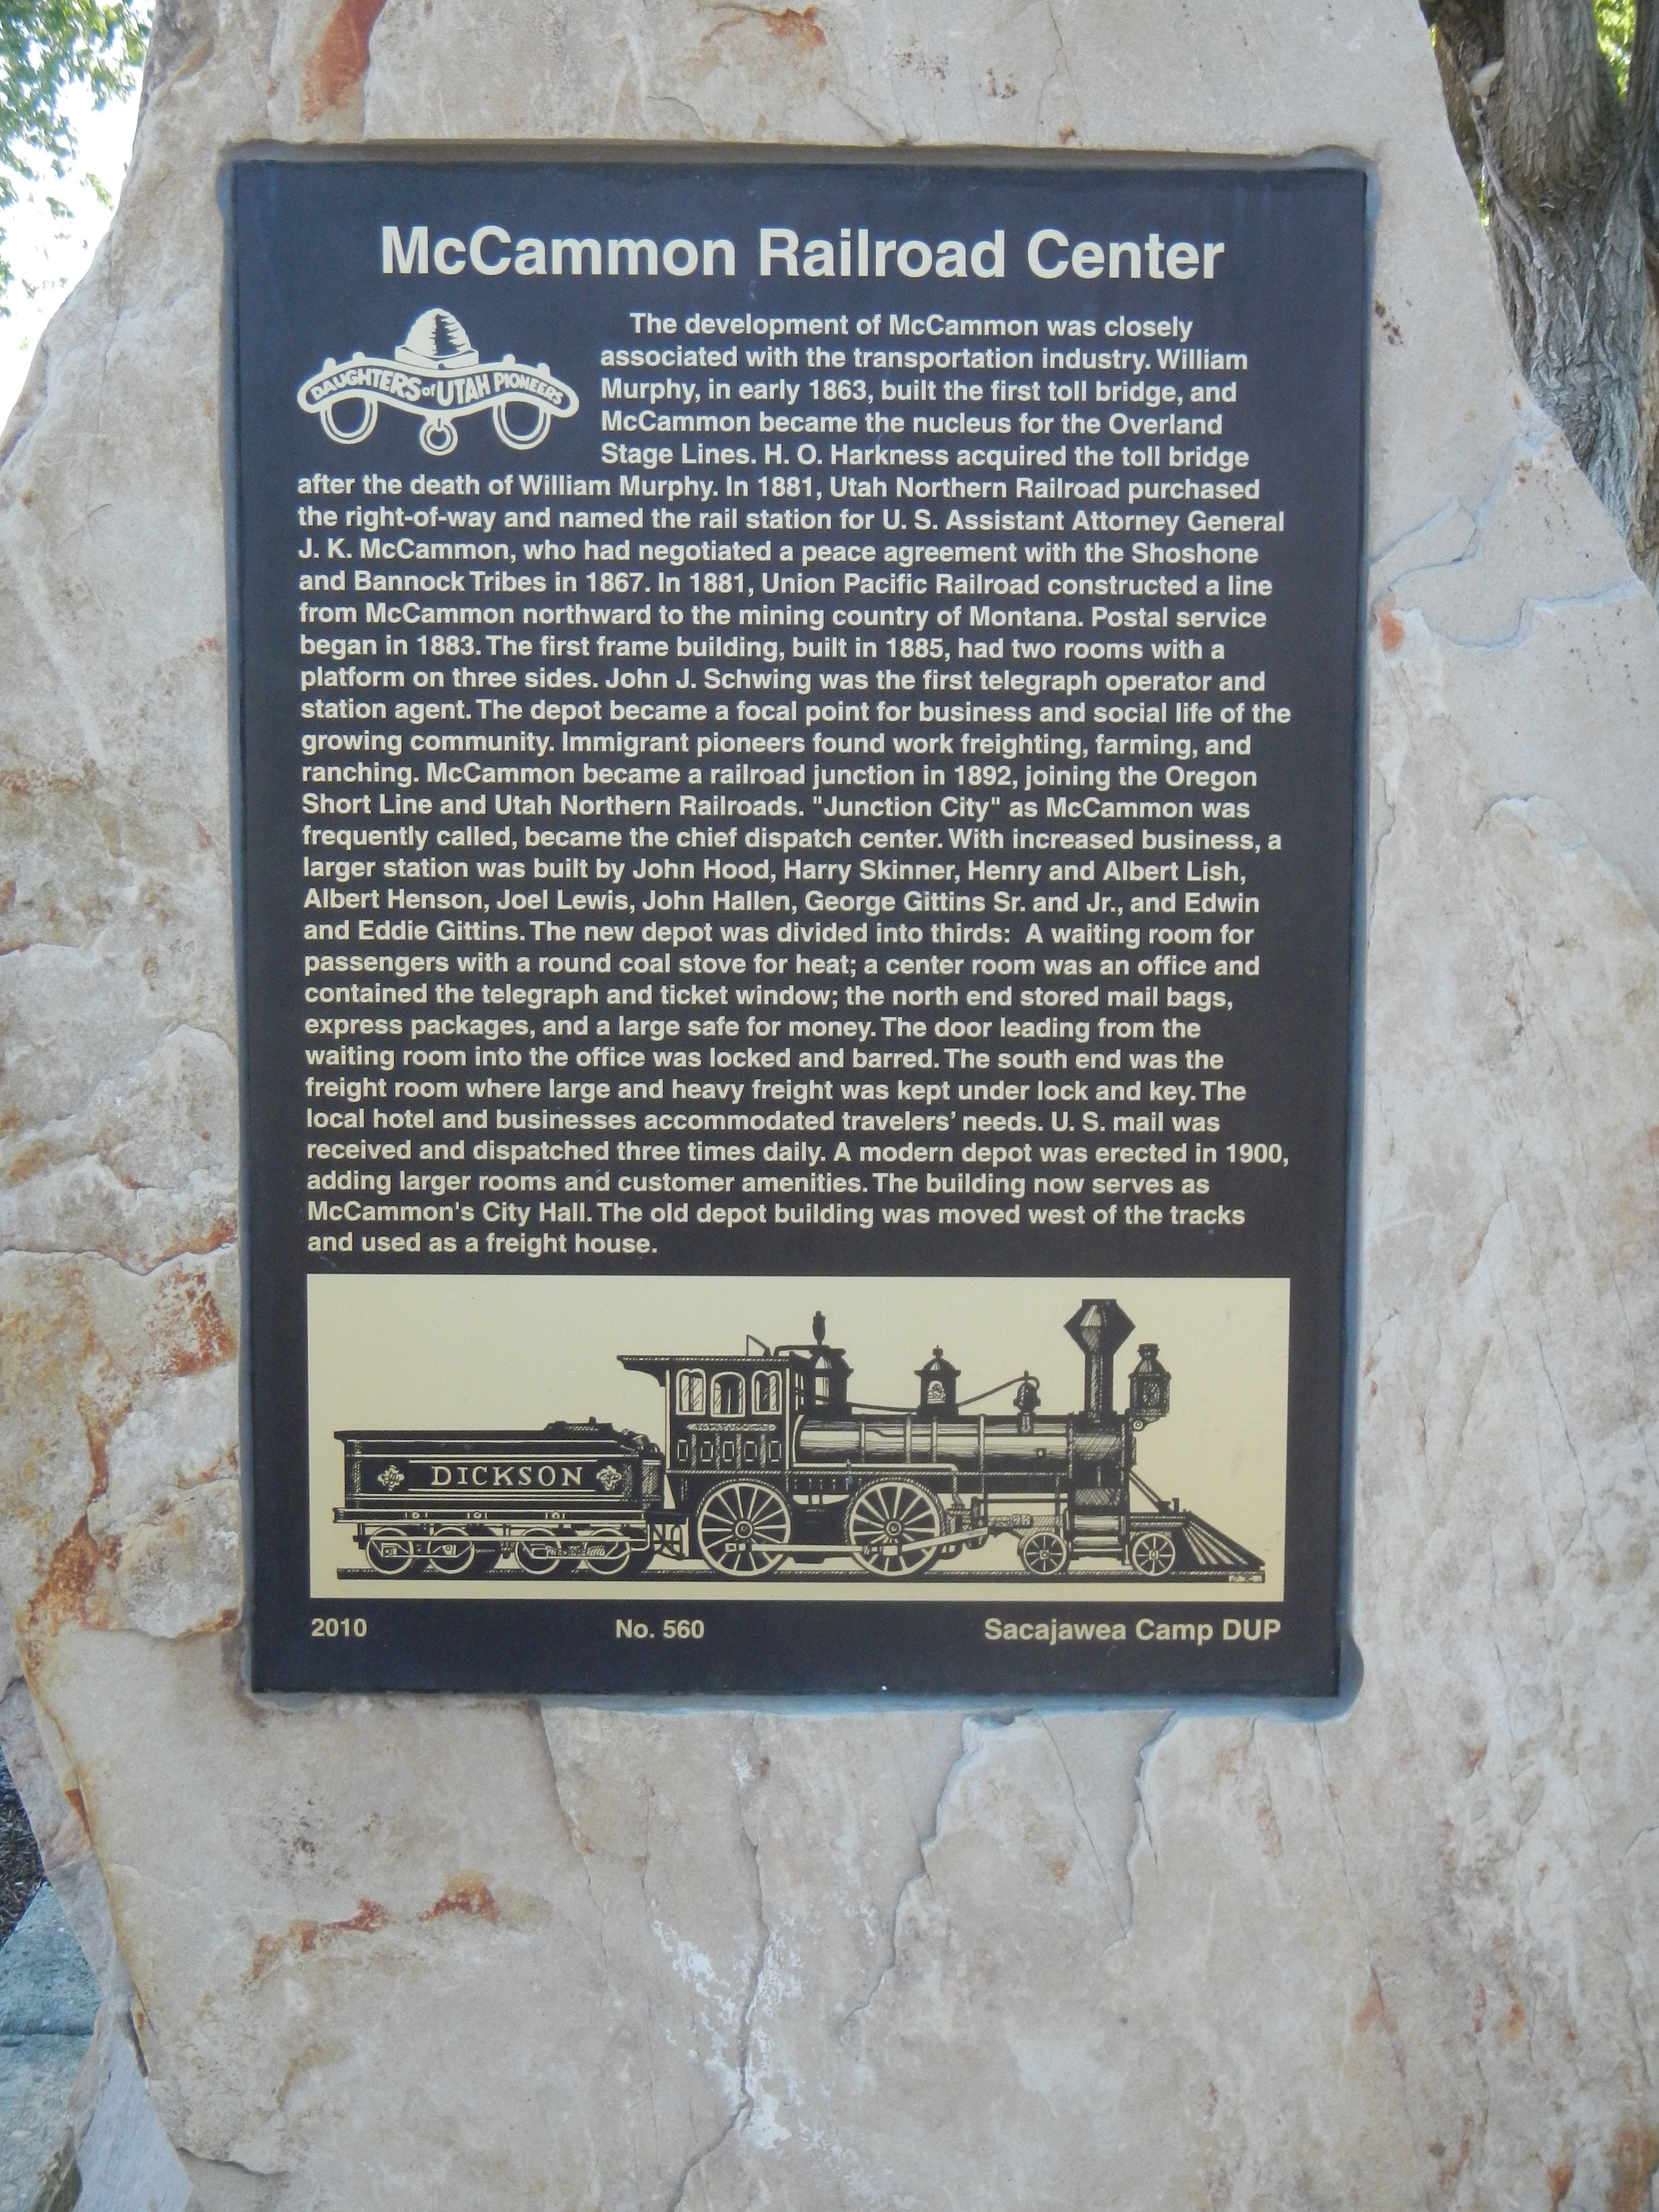
McCammon is a city in Bannock County, Idaho, United States. It is part of the Pocatello, Idaho Metropolitan Statistical Area'. The population was 809 at the 2010 census. In 1892, McCammon became the junction point between the Oregon Short Line Railroad and Utah and Northern Railway, and city gained the nickname Junction City.[4]
Geography[edit]
McCammon is located at 42°38′56″N 112°11′36″W / 42.64889°N 112.19333°W (42.648993, -112.193366).[5]
According to the United States Census Bureau, the city has a total area of 2.28 square miles (5.91 km2), of which, 2.25 square miles (5.83 km2) is land and 0.03 square miles (0.08 km2) is water.[6]
Demographics[edit]
| Census | Pop. | Note | %± |
|---|---|---|---|
| 1910 | 321 | — | |
| 1920 | 467 | 45.5% | |
| 1930 | 497 | 6.4% | |
| 1940 | 489 | −1.6% | |
| 1950 | 578 | 18.2% | |
| 1960 | 557 | −3.6% | |
| 1970 | 623 | 11.8% | |
| 1980 | 770 | 23.6% | |
| 1990 | 722 | −6.2% | |
| 2000 | 805 | 11.5% | |
| 2010 | 809 | 0.5% | |
| 2019 (est.) | 831 | [3] | 2.7% |
| U.S. Decennial Census[7] | |||
2010 census[edit]
As of the census[2] of 2010, there were 809 people, 287 households, and 217 families living in the city. The population density was 359.6 inhabitants per square mile (138.8/km2). There were 333 housing units at an average density of 148.0 per square mile (57.1/km2). The racial makeup of the city was 97.7% White, 0.4% African American, 0.5% Native American, 0.2% from other races, and 1.2% from two or more races. Hispanic or Latino of any race were 2.3% of the population.
There were 287 households, of which 39.7% had children under the age of 18 living with them, 61.0% were married couples living together, 8.0% had a female householder with no husband present, 6.6% had a male householder with no wife present, and 24.4% were non-families. 22.0% of all households were made up of individuals, and 9.4% had someone living alone who was 65 years of age or older. The average household size was 2.82 and the average family size was 3.29.
The median age in the city was 34.8 years. 30.7% of residents were under the age of 18; 7.3% were between the ages of 18 and 24; 23.2% were from 25 to 44; 25.1% were from 45 to 64; and 13.7% were 65 years of age or older. The gender makeup of the city was 51.3% male and 48.7% female.
2000 census[edit]
As of the census[8] of 2000, there were 805 people, 271 households, and 213 families living in the city. The population density was 566.7 inhabitants per square mile (218.8/km2). There were 296 housing units at an average density of 208.4 per square mile (80.5/km2). The racial makeup of the city was 94.53% White, 0.50% African American, 0.75% Native American, 0.37% Asian, 0.12% Pacific Islander, 1.61% from other races, and 2.11% from two or more races. Hispanic or Latino of any race were 3.48% of the population.
There were 271 households, out of which 40.2% had children under the age of 18 living with them, 67.9% were married couples living together, 8.1% had a female householder with no husband present, and 21.4% were non-families. 19.2% of all households were made up of individuals, and 9.6% had someone living alone who was 65 years of age or older. The average household size was 2.97 and the average family size was 3.45.
In the city, the population was spread out, with 33.2% under the age of 18, 9.4% from 18 to 24, 23.1% from 25 to 44, 21.7% from 45 to 64, and 12.5% who were 65 years of age or older. The median age was 30 years. For every 100 females, there were 95.9 males. For every 100 females aged 18 and over, there were 96.4 males.
The median income for a household in the city was $32,500, and the median income for a family was $40,833. Males had a median income of $35,078 versus $20,750 for females. The per capita income for the city was $14,323. About 5.5% of families and 8.9% of the population were below the poverty line, including 11.4% of those under age 18 and 4.7% of those aged 65 or over.
Climate[edit]
This climatic region is typified by large seasonal temperature differences, with warm to hot (and often humid) summers and cold (sometimes severely cold) winters. According to the Köppen Climate Classification system, McCammon has a humid continental climate, abbreviated "Dfb" on climate maps.[9]
| Climate data for McCammon, Idaho, 1991–2020 normals, extremes 1949–present | |||||||||||||
|---|---|---|---|---|---|---|---|---|---|---|---|---|---|
| Month | Jan | Feb | Mar | Apr | May | Jun | Jul | Aug | Sep | Oct | Nov | Dec | Year |
| Record high °F (°C) | 52 (11) |
63 (17) |
74 (23) |
85 (29) |
94 (34) |
98 (37) |
103 (39) |
101 (38) |
103 (39) |
89 (32) |
72 (22) |
61 (16) |
103 (39) |
| Mean maximum °F (°C) | 43.6 (6.4) |
49.9 (9.9) |
64.6 (18.1) |
75.5 (24.2) |
82.6 (28.1) |
89.9 (32.2) |
95.8 (35.4) |
94.3 (34.6) |
88.3 (31.3) |
76.8 (24.9) |
61.8 (16.6) |
48.3 (9.1) |
96.3 (35.7) |
| Mean daily maximum °F (°C) | 32.2 (0.1) |
37.1 (2.8) |
48.8 (9.3) |
58.3 (14.6) |
68.0 (20.0) |
77.0 (25.0) |
87.3 (30.7) |
85.6 (29.8) |
75.9 (24.4) |
61.4 (16.3) |
45.6 (7.6) |
33.5 (0.8) |
59.2 (15.1) |
| Daily mean °F (°C) | 23.7 (−4.6) |
27.7 (−2.4) |
37.4 (3.0) |
45.3 (7.4) |
53.7 (12.1) |
61.5 (16.4) |
69.6 (20.9) |
68.1 (20.1) |
59.1 (15.1) |
46.8 (8.2) |
34.8 (1.6) |
25.3 (−3.7) |
46.1 (7.8) |
| Mean daily minimum °F (°C) | 14.6 (−9.7) |
18.3 (−7.6) |
26.1 (−3.3) |
32.3 (0.2) |
39.4 (4.1) |
46.0 (7.8) |
52.0 (11.1) |
50.7 (10.4) |
42.2 (5.7) |
32.3 (0.2) |
24.0 (−4.4) |
17.1 (−8.3) |
32.9 (0.5) |
| Mean minimum °F (°C) | −4.4 (−20.2) |
−0.8 (−18.2) |
10.7 (−11.8) |
19.4 (−7.0) |
26.7 (−2.9) |
33.0 (0.6) |
41.7 (5.4) |
38.3 (3.5) |
29.2 (−1.6) |
17.1 (−8.3) |
5.4 (−14.8) |
−3.7 (−19.8) |
−9.3 (−22.9) |
| Record low °F (°C) | −28 (−33) |
−26 (−32) |
−8 (−22) |
12 (−11) |
21 (−6) |
26 (−3) |
34 (1) |
30 (−1) |
22 (−6) |
−2 (−19) |
−17 (−27) |
−31 (−35) |
−31 (−35) |
| Average precipitation inches (mm) | 1.80 (46) |
1.32 (34) |
1.24 (31) |
1.19 (30) |
2.01 (51) |
1.17 (30) |
0.60 (15) |
1.04 (26) |
1.24 (31) |
1.15 (29) |
0.97 (25) |
1.73 (44) |
15.46 (392) |
| Average snowfall inches (cm) | 16.8 (43) |
7.0 (18) |
3.5 (8.9) |
1.6 (4.1) |
0.1 (0.25) |
0.0 (0.0) |
0.0 (0.0) |
0.0 (0.0) |
0.0 (0.0) |
0.6 (1.5) |
2.2 (5.6) |
12.9 (33) |
44.7 (114.35) |
| Average extreme snow depth inches (cm) | 12.2 (31) |
10.7 (27) |
5.9 (15) |
0.6 (1.5) |
0.0 (0.0) |
0.0 (0.0) |
0.0 (0.0) |
0.0 (0.0) |
0.0 (0.0) |
0.3 (0.76) |
1.8 (4.6) |
7.7 (20) |
16.0 (41) |
| Average precipitation days (≥ 0.01 in) | 11.1 | 9.2 | 8.5 | 8.8 | 9.2 | 6.5 | 4.2 | 4.7 | 4.8 | 6.8 | 7.7 | 12.0 | 93.5 |
| Average snowy days (≥ 0.1 in) | 7.8 | 4.7 | 2.0 | 0.9 | 0.2 | 0.0 | 0.0 | 0.0 | 0.0 | 0.3 | 2.5 | 6.1 | 24.5 |
| Source 1: NOAA[10] | |||||||||||||
| Source 2: National Weather Service[11] | |||||||||||||
See also[edit]
References[edit]
- ^ "2019 U.S. Gazetteer Files". United States Census Bureau. Retrieved July 9, 2020.
- ^ a b "U.S. Census website". United States Census Bureau. Retrieved December 18, 2012.
- ^ a b "Population and Housing Unit Estimates". United States Census Bureau. May 24, 2020. Retrieved May 27, 2020.
- ^ "McCammon Railroad Center". Daughters of Utah Pioneers. 2010.
- ^ "US Gazetteer files: 2010, 2000, and 1990". United States Census Bureau. February 12, 2011. Retrieved April 23, 2011.
- ^ "US Gazetteer files 2010". United States Census Bureau. Archived from the original on January 12, 2012. Retrieved December 18, 2012.
- ^ "Census of Population and Housing". Census.gov. Retrieved June 4, 2015.
- ^ "U.S. Census website". United States Census Bureau. Retrieved January 31, 2008.
- ^ Climate Summary for McCammon, Idaho
- ^ "U.S. Climate Normals Quick Access – Station: McCammon, ID". National Oceanic and Atmospheric Administration. Retrieved July 7, 2023.
- ^ "NOAA Online Weather Data – NWS Pocatello". National Weather Service. Retrieved July 7, 2023.
External links[edit]
Municipalities and communities of Bannock County, Idaho, United States | ||
|---|---|---|
| Cities |  | |
| CDPs | ||
| Unincorporated communities | ||
| Indian reservation | ||
| Ghost town | ||
| Footnotes | ‡This populated place also has portions in an adjacent county or counties | |
| International | |
|---|---|
| National | |